Case Study 05 | Analytics and Usability Testing Reporting

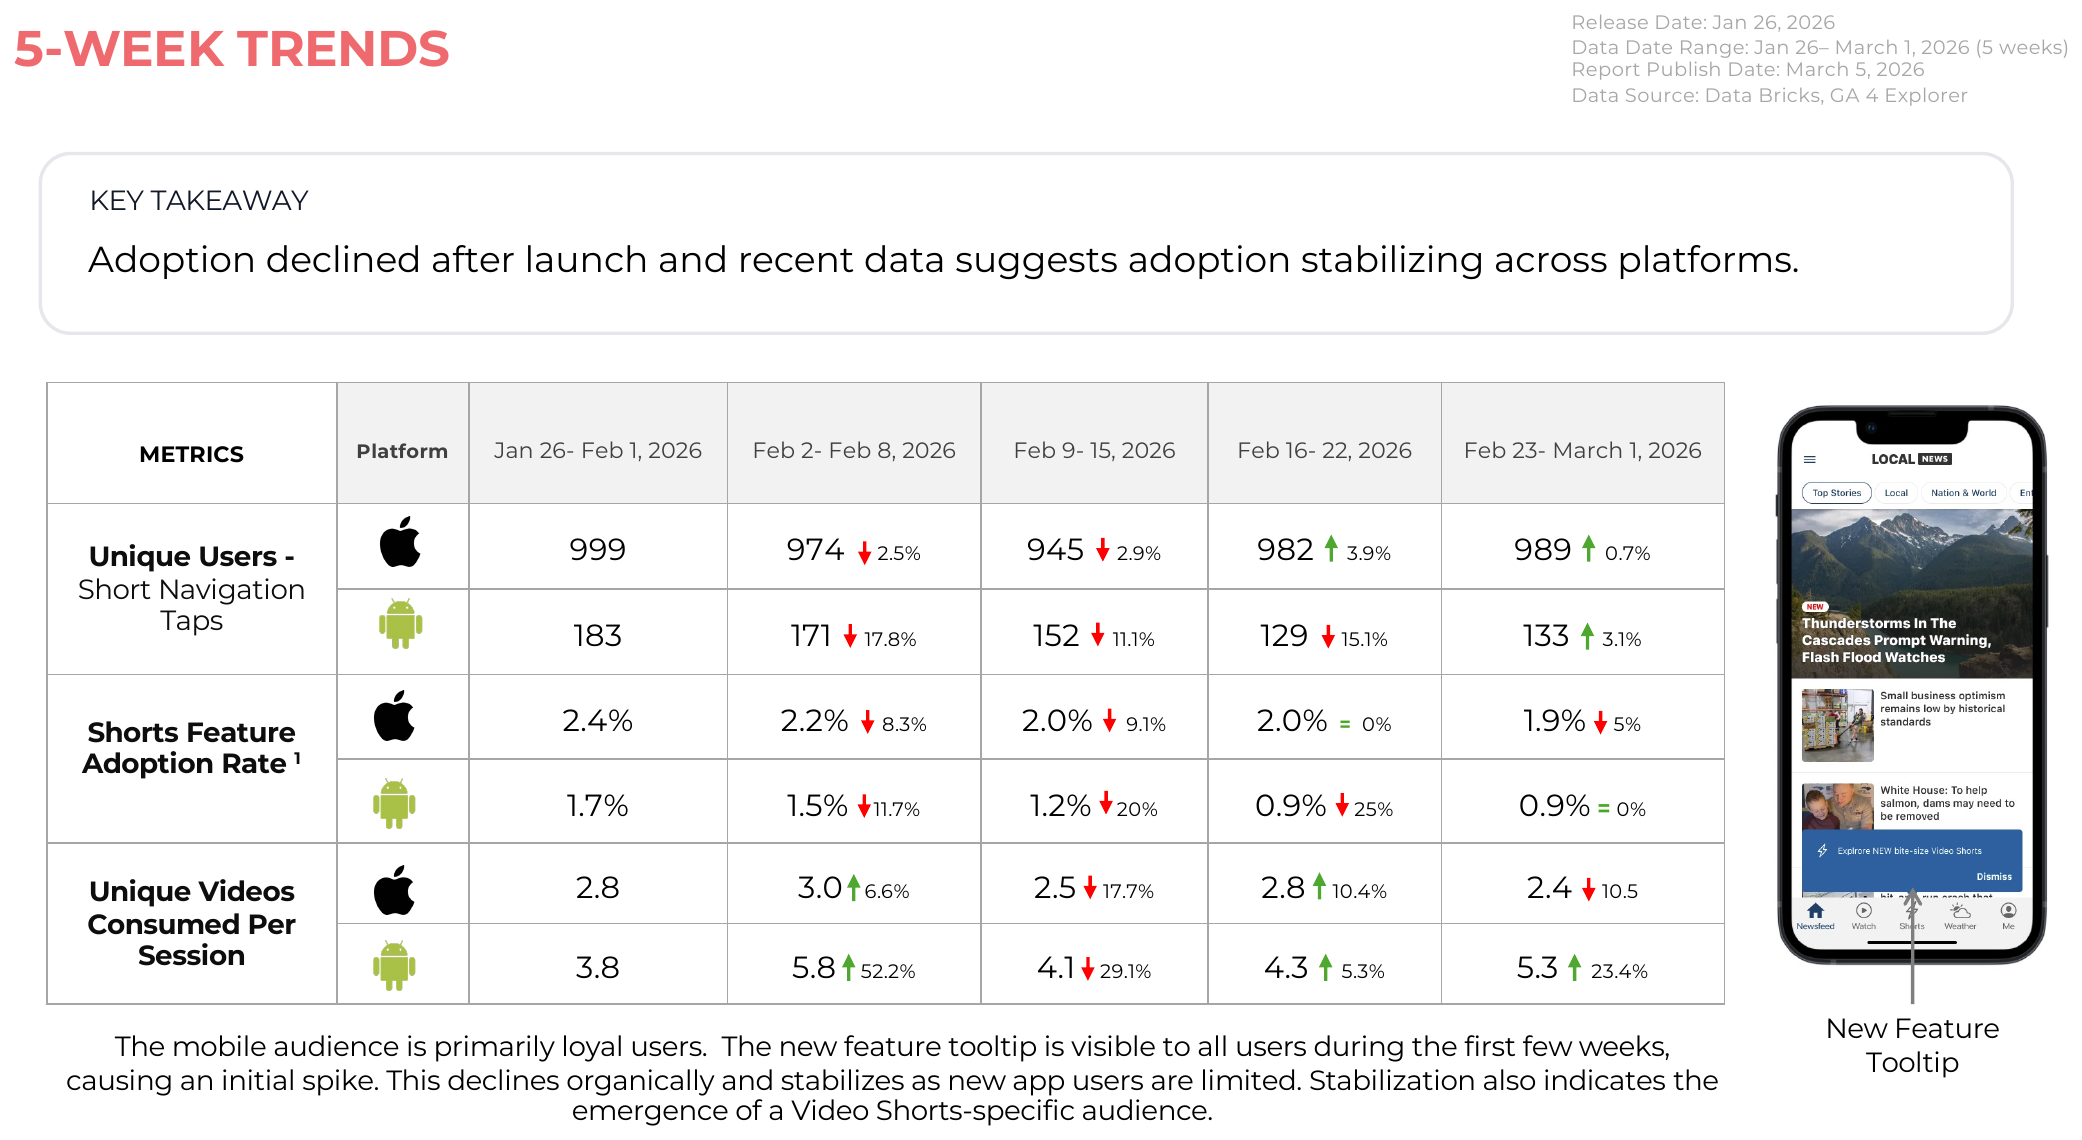
Faster product decisions through usability testing and behavioral analytics.

Product teams often had to decide quickly whether to improve, remove or continue investing in a feature. In these cases, usability testing explained what customers were struggling with, while behavioral analytics showed whether those patterns mattered at scale. I used both together across three product questions, helping teams improve a redesign, remove a low-value feature, and continue a beta with stronger evidence.

Tennis ChannelRead AloudVideo Shorts
Infographic showing how usability testing and behavioral analytics together support faster product decisions.
Usability testing and behavioral analytics combined into clearer product decisions.
58 to 84
UMUX improvement in the Tennis Channel benchmark, supporting the redesign direction before build
$35K per year
saved after Read Aloud research supported removing a low-value shipped feature across 80+ stations
49%
engagement-time lift per session in the Video Shorts beta, supporting continued investment
01

Three product questions needed evidence strong enough to support a decision

Each example started with a different business decision: should we build this redesign, keep this feature, or invest further in this beta? By combining user behavior with observed usability issues, I helped teams make faster decisions with more confidence.

Build

Tennis Channel usability testing showed whether the redesign was ready to move forward and where one workflow still needed attention.

Remove

Read Aloud research showed that the shipped feature had limited customer value and supported a removal decision that reduced annual cost.

Continue

Video Shorts telemetry showed stronger engagement among adopters while also identifying the exit behavior and launch effects that needed to be monitored.
02

Tennis Channel: validate the redesign before production

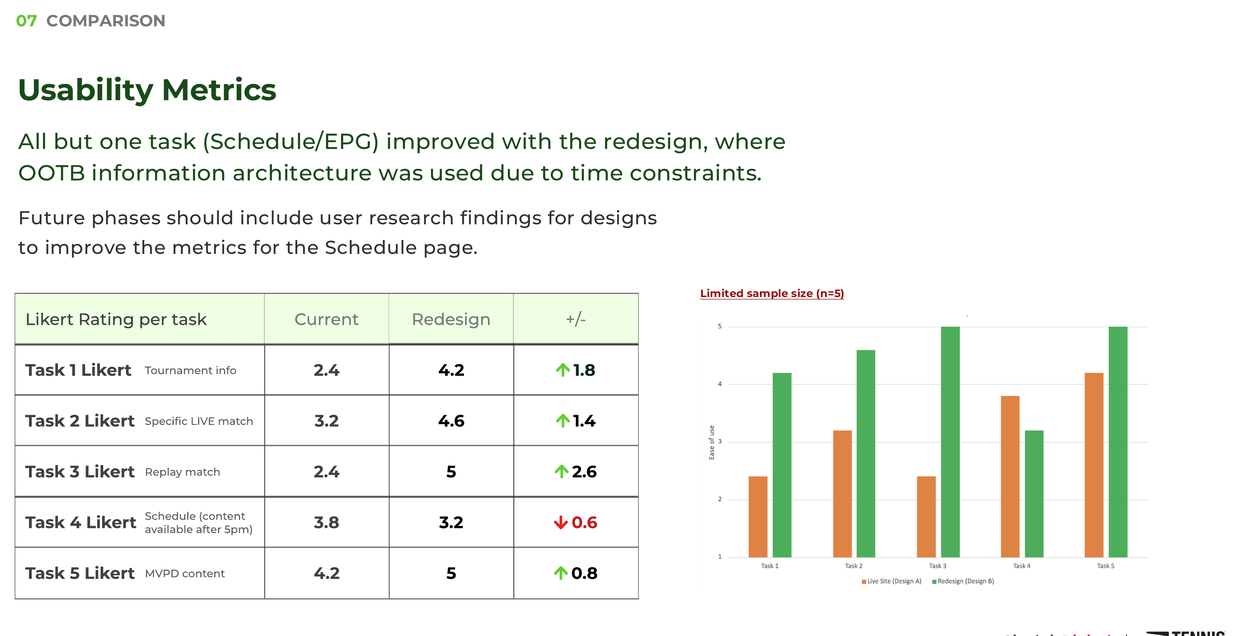
A fast benchmark compared the live experience with the proposed Figma redesign. The redesign improved four of five tasks and moved UMUX from 58 to 84; the schedule/EPG task remained the key regression to address.

Benchmark report comparing the live site and proposed redesign.

Benchmark report comparing the live site and proposed redesign.

View full size
Decision

Greenlight the redesign direction before a line of production code was written, while scoping the schedule page as a follow-up.

03

Read Aloud: know when to remove a shipped feature

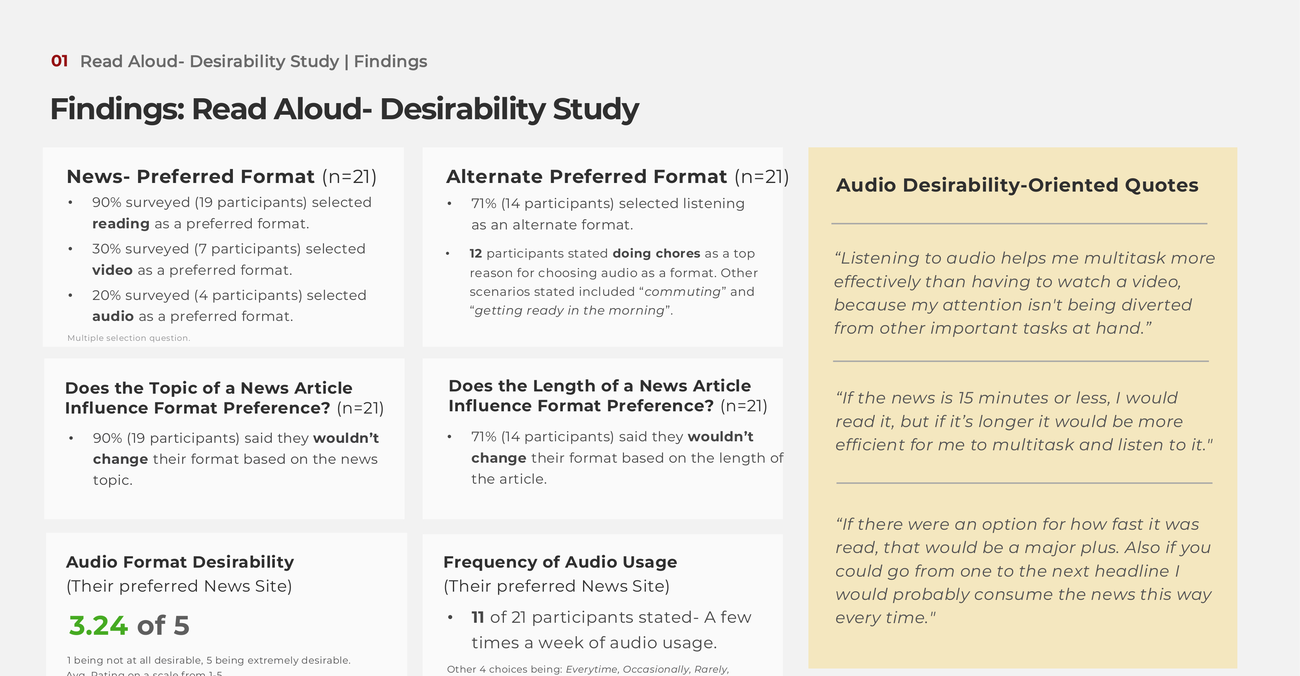
Two qualitative studies with 21 participants tested discoverability and desirability. Nineteen of 21 participants preferred reading for local-news stories; interest in audio rose only slightly for multitasking contexts.

Desirability study results.

Desirability study results.

View full size
Decision

Recommend removal rather than further investment. Read Aloud was removed across 80+ stations and vendor terms were renegotiated, saving roughly $35K annually.

04

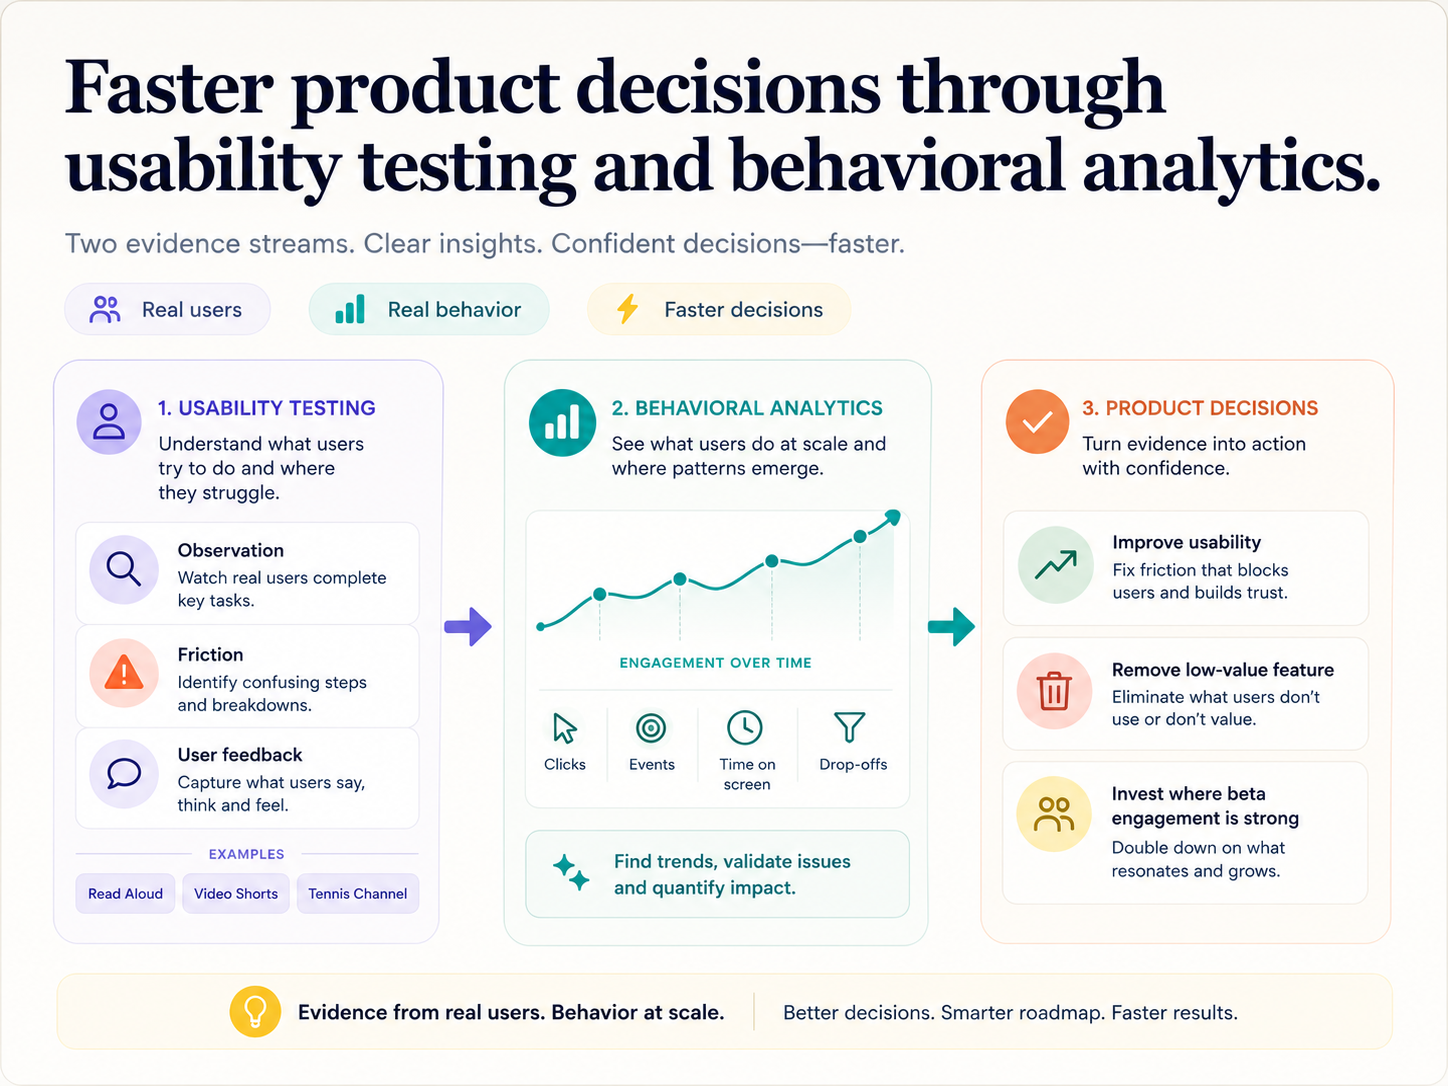
Video Shorts: measure the beta without overreading launch data

A five-week analytics readout across three markets showed 5.9% adoption and a 49% engagement-time lift per session. I caveated week-one adoption because the launch tooltip inflated the initial spike and anchored the recommendation on the stabilized trend.

Video Shorts beta readout across three local news markets.

Video Shorts beta readout across three local news markets.

View full size
Decision

Continue investment and increase publishing cadence to support engagement rather than treating the launch spike as proof on its own.

05

What connects these three studies

Match method to decision

Benchmark usability, qualitative desirability and product analytics each answered a different question.

State the limitation

Small samples, internal recruiting and launch effects were made visible rather than hidden.

End with a recommendation

Each study changed a roadmap direction: build, remove or continue investment.